Every now and then a data point comes along that makes you sit back think, “hmm, that is interesting.” – Not interesting in that it forms the basis of a tactical investment move but interesting in that it helps us better understand the environment in which we invest. For example, Josh Brown, the Reformed Broker, highlighted this week that the ETF with the highest investor inflows year to date is now the MSCI USA Minimum Volatility ETF. It just stole the lead from the SPDR Gold Trust. This tells you something interesting about investor sentiment and behaviour. Investors likely ran for the supposed protection of gold when the markets bottomed mid-February, driving the popularity of the Gold ETF. Now that stocks have come racing back, investors are moving back into equities but not whole-heartedly as they’re trying to protect themselves by only investing in stocks that have historically been less volatile than the market as a whole. This represents a fairly typical pattern of investor behaviour – chase performance, sell risk at the bottom, chase performance, buy risk at the top. It’s also indicative of the behavioural bias that people have where they always feel they have to do something in response to market moves. Better to just stick with a disciplined plan and execute that plan irrespective of others’ fear or euphoria. Nonetheless, we can still sit back while we execute and say, “that’s interesting!”
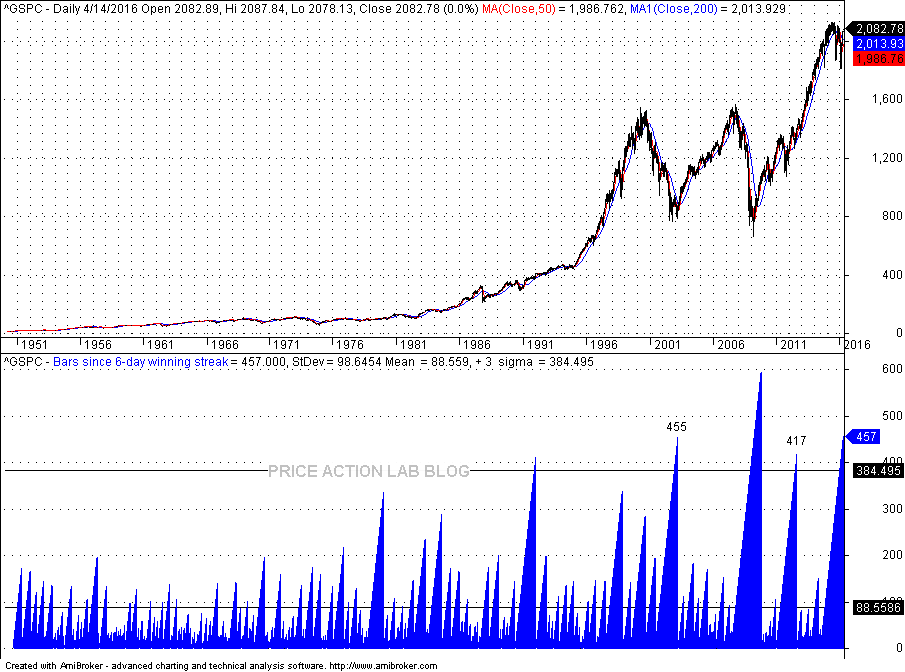
On the other other hand, every now and then, actually much more often than that, a data point comes along that leaves us scratching our head saying, “wow, either these people are just so much smarter than we are or this is just too ridiculous to think about.” Mid-April, the Price Action Lab Blog highlighted that on April 15 the S&P 500 index had reached a very important milestone – it had just reached the second longest period in the last 66 years without achieving a 6-day winning streak.” 66 years! Second long period ever! A 3 standard deviation event? Surely something is awry! Not likely. I guess the chart below from the piece is supposed to suggest that these periods without a 6 day winning streak happen right before a large market move up.

I wonder how long it’s been since we’ve had a 7-day streak? This is pure data mining and not particularly interesting or helpful. It does nothing to enhance our understanding of the environment in which we invest. And, disappointing those who seek the wisdom of the technical crystal ball, the market is now at the exact level it was on April 15.

